Standard Deviation
Standard deviation is a measure of dispersion, the degree of spread of values in a data set.
Two groups of numbers might have similar means, medians and/or modes but differ widely in dispersion. For example, it is possible that the mean income in two cities are the same, but with different dispersions of income.
The formula for standard deviation can be intimidating. Most standard deviation questions on the GMAT require you to understand the formula for standard deviation without actually going through the effort of calculating. However, official GMAT rubric does include the formula itself, so you should know the formula for the exam and be prepared to use it.
The Formula
Standard deviation is the square root of the variance; and the variance is the mean squared deviation of a dataset. And as the word “mean” indicates, the variance is an average. What are we averaging? We are averaging “squared deviations.” Here’s how we get that and compute standard deviation:
1. Calculate each deviation, the difference of that data point from the mean;
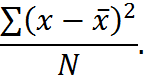
2. Average them, by adding them up and dividing by the number of points. At this point, we have the variance,
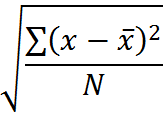
3. Take the square root of variance. Therefore, the standard deviation is
This formula is not as complicated as it first looks. With practice, you can most certainly remember the steps above. However, even once you have memorized the steps to compute standard deviation, you may still find the notion unintuitive. So, let’s take a moment to make the idea of standard deviation simpler for ourselves.
Example
Let’s compute the standard deviation for the set of numbers from 1 to 10. That is, consider the following set of values: {1, 2, 3, 4, 5, 6, 7, 8, 9, 10}.
This set has a mean of 5.5, which we can determine either with the formula for arithmetic mean or the balance concept, discussed above.
The deviations from the mean of each number and those deviations squared are:
|
Deviations and Squared Deviations |
||
|
Value |
Deviation |
Squared Deviation |
|
1 |
-4.5 |
20.25 |
|
2 |
-3.5 |
12.25 |
|
3 |
-2.5 |
6.25 |
|
4 |
-1.5 |
2.25 |
|
5 |
-0.5 |
0.25 |
|
6 |
0.5 |
0.25 |
|
7 |
1.5 |
2.25 |
|
8 |
2.5 |
6.25 |
|
9 |
3.5 |
12.25 |
|
10 |
4.5 |
20.25 |
|
Sum of Squares |
|
82.50 |
After the squaring operation, we arrive at a figure for the sum of the squared deviations, which we can divide by N to get the variance. Since N is 10, the variance is
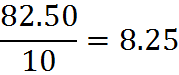
In other words, 8.25 is the average of the squared deviations.
Finally, to get the standard deviation, we take the square root of the variance.
![]()
so the standard deviation is roughly 2.87. On the GMAT, we would not be expected to make that last calculation on our noteboards; we might be asked to estimate it by noting that that the square root of 8.25 is a little less than the square root of 9, which is 3.
Making Standard Deviation Simple
The standard deviation is not as complex as it may first appear. Here is a further explanation that might make it all seem suddenly quite simple.
Part of the complexity of the standard deviation formula is that we are squaring a bunch of numbers and later taking the square root. What’s the point of that?
One reason for the squaring is that we are dealing with positive numbers: the measure of dispersion is all about how far the numbers are from the mean, so it doesn’t matter whether the difference is positive or negative.
If the point of squaring is to get positive differences, we might wonder why, then, the standard deviation involves squaring and doesn’t just use absolute value. The reason is that the standard deviation concept was developed when we had calculus at our disposal and not computers. Absolute values are unwieldy in calculus (because they are not smooth functions and thus difficult to use in integrals and take derivatives of), whereas squares and square roots are calculus-friendly. If we had invented standard deviation in the computer era, we probably would have defined it as simply the average of the positive difference of each number from the mean.
In other words, the standard deviation is not so different from the average distance of each point in a dataset from the mean of that dataset. This point may help you to remember, use, and think about the formula.
Note, however, that while standard deviation is like the average distance from the mean, it’s not quite equal in most data sets. Looking back at our example above, we can see that the average of the absolute value of the differences from the mean, while conceptually similar to the standard deviation, yields a different value. In that example, the average absolute difference is 2.5, which indeed is similar to, but not equal to, 2.87.
Practice Questions
Symmetric Distribution:
https://www.gmatfree.com/symmetric-distribution
Standard Deviation of a Subset:
https://www.gmatfree.com/standard-deviation-of-a-subset