Averages: Arithmetic Mean (Average), Median, and Mode
Descriptive statistics are measures of a population or data set. In other words, you have a group of numbers, and the statistics tell us about that group – what the values are clustered around or how tightly they are clustered, for example.
The descriptive statistics most commonly tested on the GMAT are the three main types of average, more formally known as “measures of central tendency”: the arithmetic mean or common average, the median, and the mode. We’ll start with a discussion of the mode.
Mode
The mode is the most frequently occurring value in the data. If we go through a data set and tick off once each occurrence of a particular value, we obtain the frequency count for the data. The mode is the value with the highest frequency count.
For example, if there are seven 12-year olds in a class, ten 13-year olds, and four 14-year olds, the mode is 13, since there are more 13 year olds than any other age. A mode is similar to a plurality in an election or vote; the candidate who gets the plurality or most votes wins in a certain election format, even he or she doesn’t get the majority (over half) of the votes.
Here’s another example. Suppose that we tally the age to the nearest whole year of a class of children and we get the following result:
|
Age in Years |
Frequency of Occurrence |
|
10 |
5 |
|
11 |
10 |
|
12 |
10 |
|
13 |
3 |
Here is a histogram of the data:
![]()
![]()
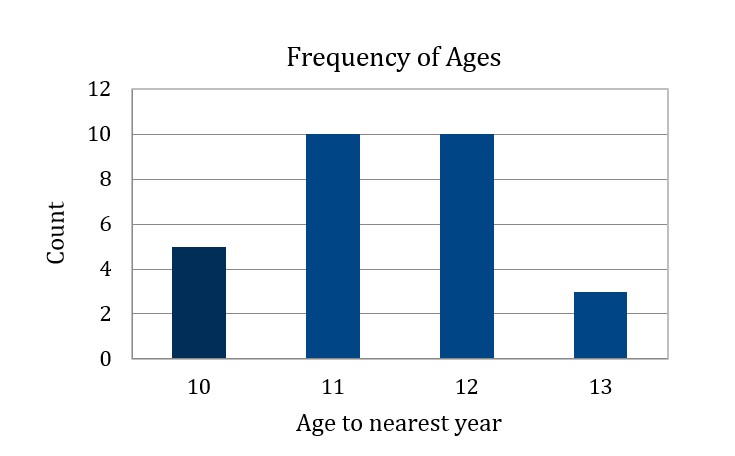
Here there are two modes: 11 years and 12 years. A list of numbers may have more than one mode.
Median
The median is the middle value in the data set. To find the median of a set of numbers, rank the numbers. If the number of numbers is odd, the median is the middle ranking score. If the number of numbers is even, then the average of the two middle points is the median. There is always one median for a group of numbers.
For example, consider the data in the table and histogram. There are 28 children in the classroom. This is an even number of values, so the median will be the average of the middle two values–the 14th and the 15th values. Both of these values are 11, so the median of the children’s ages is 11.
To find the median, we generally have to put the elements of the set in order first – and count them, if we don’t know the number of elements in the set.
Average (Arithmetic Mean)
No GMAT question will ever refer to simply an “average,” leaving you to guess what it’s talking about. If a question concerns the arithmetic mean, it will generally use the phrase “average (arithmetic mean).” This average is the sum of all values divided by the number of values:
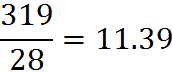
Consider the data in the table and histogram above. To compute the arithmetic mean of the children’s ages, we find the sum of the ages in years for this class, which is 319. The total number of children is 28. So we divide 319 by 28 to get the mean age:
Weighted Average
Understanding weighted averages will help you solve some GMAT questions that specifically deal with an arithmetic mean and also some probability questions.
The weighted average is similar to the arithmetic mean. When totaling the individual values, each is multiplied by a weighting factor, and the total is then divided by the sum of all the weighting factors. These weighting factors allow us to count some values as “more important” in finding the final value than others.
Let’s say we have two classes, one with 20 students, and one with 30 students. The grades in each class on a particular test were:
Morning class = 62, 67, 71, 74, 76, 77, 78, 79, 79, 80,
80, 81, 81, 82, 83, 84, 86, 89, 93, 98
Afternoon class = 81, 82, 83, 84, 85, 86, 87, 87, 88, 88, 89, 89,
89, 90, 90, 90, 90, 91, 91, 91, 92, 92, 93, 93, 94, 95, 96, 97, 98, 99
The arithmetic mean of scores in the morning class is 80% and the arithmetic mean of scores in the afternoon class is 90%. However, the average of all the students’ grades is not the average of 80% and 90%.
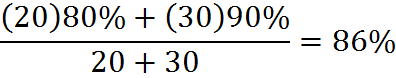
To find that the overall average, we can to total all the grades and divide by the total number of students:
Or, we can compute weighted average of the two class means already calculated, using the number of students in each class as the weighting factor:
Note that if we no longer had the individual students’ grades, but only had the class averages and the number of students in each class, we could still find the mean of all the students’ grades, in this way, by finding the weighted mean of the two class averages.
In fact, if we knew only the average for each group and the fact that the afternoon class had 50% more students, we could again compute the overall average. If the afternoon class has 50% more students, then we could say that the morning class has x students and the afternoon class has 1.5x students. The total would be 2.5x students. Therefore, the overall average is
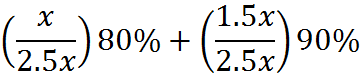
The x‘s cancel:
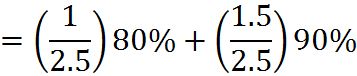
The fractions are simplified by factoring out and canceling 0.5:

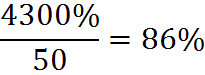
The fractions are not too hard to work with, but this computation is easier using decimals:
![]()
![]()
As you can see, there are many ways to work with the average formula. With practice, you’ll use the fastest method for a given problem. Which brings us to a powerful method…
The “Balance” Concept in an Average
The example of morning and afternoon classes above demonstrates the concept of “balance” in an average (arithmetic mean). The averages of the two classes were 80% and 90%, but the overall average was not 85%, because the afternoon class had more “pull” in greater numbers.
In fact, such a “tug of war” goes on whenever there is arithmetic mean. The differences from the average always sum to zero.
To see how useful this fact can be, consider an example. Suppose that 14, 20, and x have an average (arithmetic mean) of 16. We can know in a heartbeat that x = 14, because the differences from the average always sum to zero. The difference from 14 is -2 and from 20 it’s 4. Those differences add up to two, so x must have a difference of -2, and therefore it’s 14.
Practice Questions
Import Taxes:
https://www.gmatfree.com/import-taxes
Comparing Mean and Median:
https://www.gmatfree.com/comparing-mean-and-median
Ratio of Mean to Median:
https://www.gmatfree.com/ratio-of-mean-to-median
Comparing Medians:
https://www.gmatfree.com/comparing-medians
Chris’ Average Expenses:
https://www.gmatfree.com/chris-average-expenses